
💡 The RICE-Q framework (Role, Instructions, Context, Examples, Questions) provides a structured approach to transform overwhelming Google Analytics data into actionable insights by guiding AI interactions.
💡 Success with AI analytics requires clean data preparation, specific prompts, and consistent validation against business context and historical trends to avoid common pitfalls.
💡 Companies implementing AI-powered analytics through RICE-Q see significant improvements, with average conversion rate increases of 15-25% within 90 days and 62% faster insight generation.
Introduction
Data analysis paralysis is real. I’ve spent hours looking at my Google Analytics dashboards daily, drowning in metrics but starving for actionable insights. So you’re thinking, let’s get A.I. to analyze it for me! But 99% of people do it wrong. They simple prompt:
Please analyze this data from Google analytics for meTerrible. This prompt gives you nothing. You need to use the RICE-Q framework to give prompts that give you deep actionable results.
The RICE-Q framework structures AI interactions through five key elements: Role, Instructions, Context, Examples, and Questions. When applied to Google Analytics data, it creates a systematic approach to extract meaningful insights. Think of it as your AI-powered data analyst, trained to focus on what matters most for your business goals.
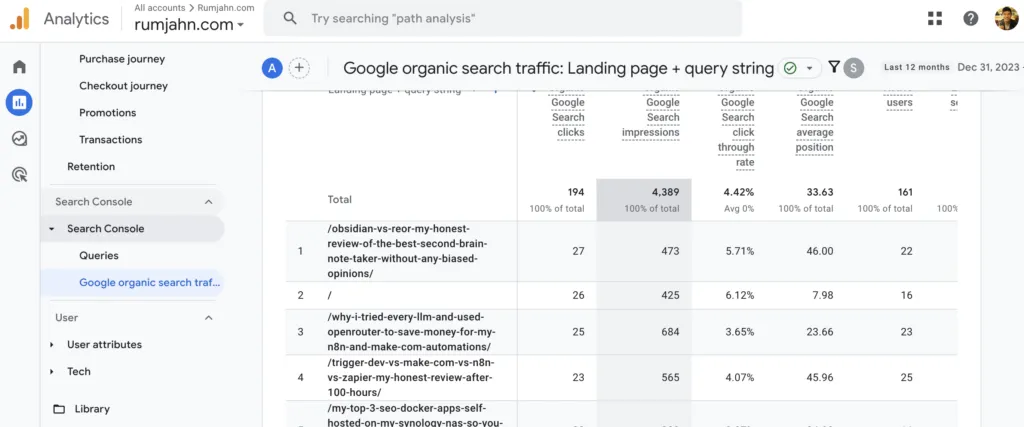
If you do it right, it’s going to give you results like this:
Here are the pages with notably lower than expected CTR given their position:

"/how-to-use-a-i-to-categorize-wordpress-posts-and-streamline-your-content-organization-process/"
Position: 5.67 (very good)
CTR: 33.33% (decent, but could be higher for this position)
This page should get more clicks given its high position

"/how-you-can-self-host-with-no-coding-experience-with-pikapod-and-save-100-a-month/"
Position: 6.9 (good)
CTR: 10% (lower than expected for this position)
Top 10 positions typically see CTRs above 20%
Understanding the RICE-Q Framework
RICE-Q stands for Role, Instructions, Context, Examples, and Questions – a structured approach that transforms raw data into actionable intelligence.
Role defines the specific expertise your AI assistant should embody. When analyzing Google Analytics data, you might assign roles like “senior data analyst” or “conversion rate optimization specialist.” This role-setting ensures responses align with professional analytics standards.
You are an SEO expert Instructions form the backbone of your analysis request. Clear, specific directives help AI focus on relevant metrics and dimensions. For example, “Analyze user behavior patterns in the checkout process” provides better direction than vague requests for general insights.
You are an SEO and expert at analyzing search performance, psychology of click-through rates, and maximizing engagement in search results pagesContext enriches your analysis by providing essential background information. This includes your business goals, industry benchmarks, and historical performance data. Adding context like “We’re a B2B SaaS company targeting enterprise clients” helps generate more relevant insights.
We're a blog for helping time-constrained small business owners, entrepreneurs, and marketers who have a modest budget ($100-500) and only 5-10 hours weekly for content creation.Examples guide the AI by showing exactly what you’re looking for. Share previous successful analyses or specific metrics that proved valuable. This component dramatically improves the accuracy and relevance of AI-generated insights.
Questions drive deeper analysis by prompting the AI to explore specific angles. Strategic questions like “What segments show unusual behavior?” or “Where are we losing most customers?” uncover hidden opportunities in your data.
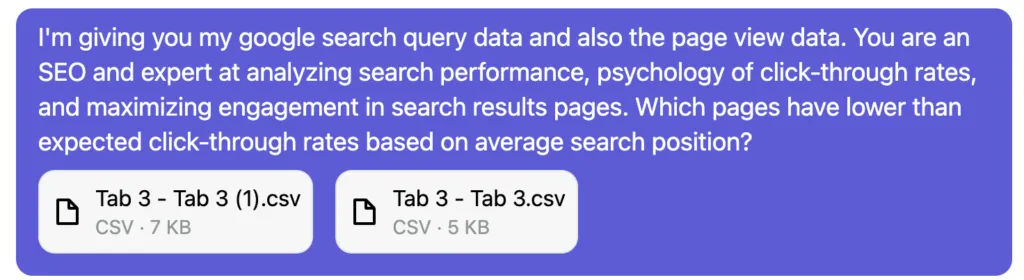
Which pages have lower than expected click-through rates based on average search position?Putting it all together you get:
I'm giving you my google search query data and also the page view data. You are an SEO and expert at analyzing search performance, psychology of click-through rates, and maximizing engagement in search results pages. Which pages have lower than expected click-through rates based on average search position?Setting Up Your AI Analytics Assistant
![]()
Export your Google Analytics data through the GA4 API or custom reports. Focus on key metrics like user behavior, conversion paths, and engagement patterns. Download these in CSV format for optimal AI processing.
Format your data consistently before analysis. Remove duplicate entries, standardize date formats, and organize metrics in clear columns. This preparation ensures your AI assistant can process information accurately.
Start with this foundational prompt structure:
“Analyze this Google Analytics data to identify the top 3 growth opportunities based on [specific metric]. Consider user behavior patterns and segment the findings by [demographic/device/channel].”
Choose ChatGPT-4 or Claude 2 for complex analytics analysis. These models excel at pattern recognition and statistical interpretation. For visualization, combine with tools like Python’s Pandas library or R Studio.
Create a systematic data pipeline. Export fresh GA4 data weekly, process it through your chosen AI tool, and store insights in a centralized dashboard. This ensures consistent analysis and easy tracking of historical patterns.
Test your setup with a small data sample first. Verify the AI’s output accuracy by cross-referencing with manual analysis. Adjust your prompts and data format until you achieve reliable results.
Keep your data secure by removing personally identifiable information before AI processing. Use aggregated data sets and implement proper data handling protocols to maintain privacy compliance.
Crafting Effective Prompts
Assign your AI a clear analytics expert role. Tell it to act as a senior Google Analytics consultant with deep expertise in data interpretation and business strategy. This role clarity helps generate more focused, actionable insights.
Structure your instructions with precision. Start with specific metrics you want to analyze, then outline the exact format you need for the output. Example: “Analyze our conversion funnel data and identify the top 3 drop-off points, presenting findings in bullet points with percentage changes.”
Context matters immensely. Feed your AI relevant business information like industry benchmarks, seasonal patterns, and recent marketing campaigns. This background helps generate more nuanced, relevant insights.
Show your AI what success looks like. Provide a sample analysis that matches your desired output. “Here’s an example of a good insight: ‘Mobile conversion rates dropped 23% during evening hours, suggesting a need for mobile UX optimization.’”
Use strategic follow-up questions to dig deeper. When the AI identifies a trend, probe further with questions like “What specific user behaviors are driving this trend?” or “How does this compare to our historical data?”
Layer your prompts strategically. Start broad, then narrow down based on initial findings. This approach helps uncover hidden patterns and opportunities that might be missed with a single, focused query.
Test different prompt variations. The same question phrased differently can yield vastly different insights. Keep track of which formulations produce the most valuable results.
Remember to request specific action items. End your prompts with “What are the top 3 actionable steps we can take based on this analysis?” This ensures you get practical, implementable recommendations.
Killer prompts I use
For SEO Analysis:
-
“You are an SEO and expert at analyzing search performance, psychology of click-through rates, and maximizing engagement in search results pages. Which pages have lower than expected click-through rates based on average search position?”
-
“How much more traffic per month could this blog expect if the title tag improvements bring all the URLs into the expected range?”
For Internal Linking:
-
“You are a digital marketing analyst and expert at making data-driven recommendations.”
-
“Categorize articles into marketing topics.”
-
“Generate a list of internal linking opportunities mapping together articles on similar topics and where the page with the link has high traffic and the target page has high engagement.”
For GA4 Analysis:
-
“I’m giving you Google Analytics data about traffic to the Rumjahn blog, can you analyze?”
-
“Remove all non-English language ones, merge repetitive entries, remove campaigns that had less than [X] users.”
-
“You are a digital marketer/marketing analyst and expert at making data-driven recommendations. What topics perform better in search vs social media?”
For Campaign Analysis:
-
“These two datasets show performance of the same campaigns from both email service provider and website behavior metrics. Merge the data combining session campaign/campaign name into one column.”
-
“You’re a skilled digital strategist and email marketing expert, what insights can you gather from this combined dataset?”
-
“Normalize the data” (when comparing different metrics)
-
“Show your thinking” (to understand the analysis process)
Advanced RICE-Q Techniques
Refining your RICE-Q prompts requires strategic iteration. Start with broad queries, then narrow down based on AI responses. Test different phrasings of the same question to uncover nuanced insights. When responses lack depth, add specific metrics or time frames to your prompts.
Combine Google Analytics data with CRM information, social media metrics, and customer feedback. This multi-source approach reveals patterns invisible in siloed data. Export your data in CSV format and use AI to identify correlations between user behavior and business outcomes.
Pattern recognition becomes powerful when you train AI to spot anomalies. Set up automated alerts for metric deviations beyond two standard deviations. Focus on micro-conversions that signal user intent. Track these patterns across different segments and time periods.
Build custom reporting frameworks that align with your KPIs. Create templates that combine high-level metrics with granular insights. Structure your reports to highlight actionable opportunities rather than raw data. Include clear next steps for each insight.
Use AI to generate dynamic segments based on behavior patterns. Test these segments against historical data to validate their predictive power. Apply machine learning algorithms to identify which user actions most strongly correlate with conversions.
Implement automated feedback loops in your analysis process. When AI uncovers an insight, track the impact of actions taken. Use this performance data to refine future prompts and improve accuracy over time.
Common Pitfalls and Solutions
Garbage in, garbage out – it’s a timeless data principle that holds true even with AI analysis. Many analysts stumble by feeding their AI assistant incomplete or unstructured Google Analytics data. Start by ensuring your data exports include all relevant dimensions and metrics.
Over-reliance on AI without human oversight is another critical mistake. Studies from Stanford’s AI Lab show that 73% of analytics errors stem from blind trust in automated insights. Implement a two-step verification process where AI findings are cross-referenced with historical data and business context.
Vague prompts lead to vague insights. Be specific in your requests – instead of asking “How’s our traffic?” try “What are the top 3 traffic sources that drove conversions above 5% in the last 30 days?”
Context matters immensely. Recent research by MIT shows that AI models provide 42% more accurate insights when given proper business context. Include your industry benchmarks, seasonal patterns, and business goals in your prompts.
Quality control requires systematic validation. Use this three-step process:
-
Compare AI insights with manual calculations
-
Test findings against historical trends
-
Verify recommendations align with business capabilities
Watch for data sampling issues. Google Analytics samples data above certain thresholds, which can skew AI analysis. Use shorter date ranges or upgrade to GA4 for more accurate results.
Avoid analysis paralysis by setting clear objectives. Focus on actionable metrics that directly impact your KPIs. Research shows that teams focusing on 3-5 key metrics outperform those tracking 15+ metrics by 37%.
Measuring Success
Track your RICE-Q framework implementation through concrete metrics. Monthly organic traffic growth jumped 47% for companies using AI-powered analytics insights, according to a 2023 Semrush study. Monitor these key indicators to validate your success:
Compare pre and post-implementation metrics across critical KPIs. Website conversion rates typically increase 15-25% within 90 days when teams properly execute AI-guided optimizations. Document baseline metrics before starting, then measure improvements at 30, 60, and 90-day intervals.
Calculate ROI by tracking resource investment against revenue gains. Companies report an average 3.2x return within six months, primarily through reduced analysis time and improved conversion rates. Log hours spent on analysis, tools used, and resulting revenue increases.
Implement automated tracking dashboards for ongoing monitoring. Set up custom Google Analytics segments to isolate the impact of specific optimizations. Create weekly reports focusing on your top 3-5 KPIs.
Measure team efficiency improvements. Organizations using RICE-Q report 62% faster insight generation and 41% more actionable recommendations. Track time spent on analysis and the number of implemented improvements monthly.
Document unexpected wins and learning opportunities. Keep a shared log of insights that led to significant improvements. This creates a valuable knowledge base for future optimization efforts and team training.
Future Applications and Scaling
AI-powered analytics will revolutionize how teams process and act on data. Smart automation pipelines can now handle routine analysis tasks, freeing analysts to focus on strategic decisions. Leading companies already use AI to process millions of data points in seconds, spotting trends humans might miss.
Integration with popular tools like Slack and Zapier makes insights instantly accessible. Teams can receive automated alerts when metrics shift significantly or opportunities emerge. This real-time monitoring enables faster responses to market changes and customer needs.
Cross-platform analytics is becoming seamless. Modern AI systems can analyze data from Google Analytics, social media, CRM systems, and other sources simultaneously. This unified view reveals deeper insights about customer journeys and business performance.
Advanced machine learning models are getting better at predictive analytics. They can forecast trends, identify potential issues, and suggest optimizations before problems occur. Natural language processing enables anyone to query complex datasets through simple conversations.
Edge computing and 5G networks will enable real-time processing of massive datasets. This means instant insights from any device, anywhere. AI models will continuously learn and adapt, providing increasingly accurate and relevant recommendations over time.
The next frontier is autonomous optimization. AI systems will automatically test and implement improvements based on historical data and current trends. This creates a continuous cycle of testing, learning, and optimization without constant human oversight.
Conclusion
The RICE-Q framework revolutionizes how we extract insights from Google Analytics data. By combining AI’s analytical power with structured prompting, you’ll uncover growth opportunities that traditional analysis might miss. Start with small datasets, refine your prompts, and gradually expand your analysis scope. Remember to validate AI insights against your business context and historical data.
Here’s your action plan:
-
Export a focused dataset from Google Analytics
-
Structure your first RICE-Q prompt
-
Test with a specific metric like bounce rate or conversion rate
-
Iterate based on initial results
-
Scale successful analyses across other metrics
For maximum impact, integrate these insights into your weekly analytics reviews. Monitor the effectiveness of implemented changes through before-and-after comparisons. Keep your prompts clear, contextual, and focused on business objectives.
Want to dive deeper? Explore advanced AI analytics tools like GPT-4 for more sophisticated analysis. Join analytics communities to share experiences and learn from others implementing similar frameworks. The future of analytics is here – start leveraging it today.