💡 Leveraging AI for data interpretation provides deeper insights and actionable suggestions to improve your SEO strategy.
💡 Save hours with your reporting process with n8n/make.com and baserow
How I used A.I. to be an SEO expert and analyzed my Google analytics data in n8n and make.com
https://www.youtube.com/watch?v=KlWFhTz9M9g
SEO can be a real headache. I used to spend hours poring over Google Analytics data. It was a weekly chore that ate up half my day. But what if there was a better way?
I decided to automate the process. Using n8n and make.com, I created a workflow that changed everything. It pulls Google Analytics data, compares it to last week, and gives me actionable insights.
Stick with me, and I’ll show you how to become an SEO whiz without the hassle. You’ll learn to leverage AI for data analysis and streamline your reporting process. Let’s dive in!
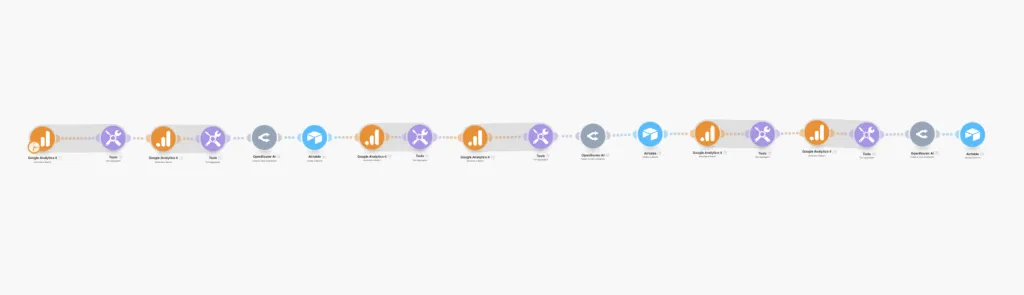
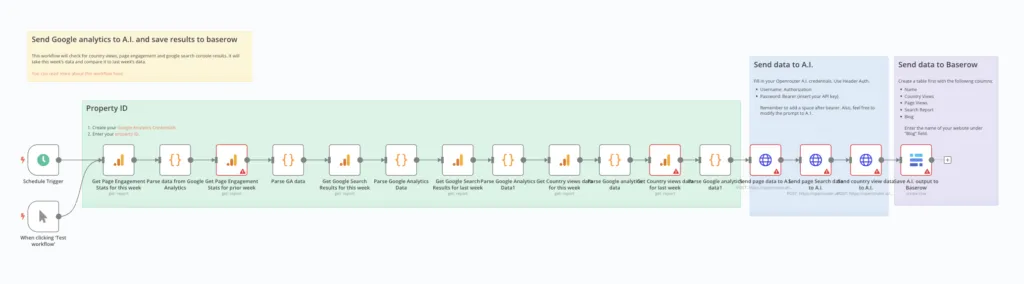
This is my Google analytics flow (You can download this blueprint by clicking below)
Your A.I. SEO Agent
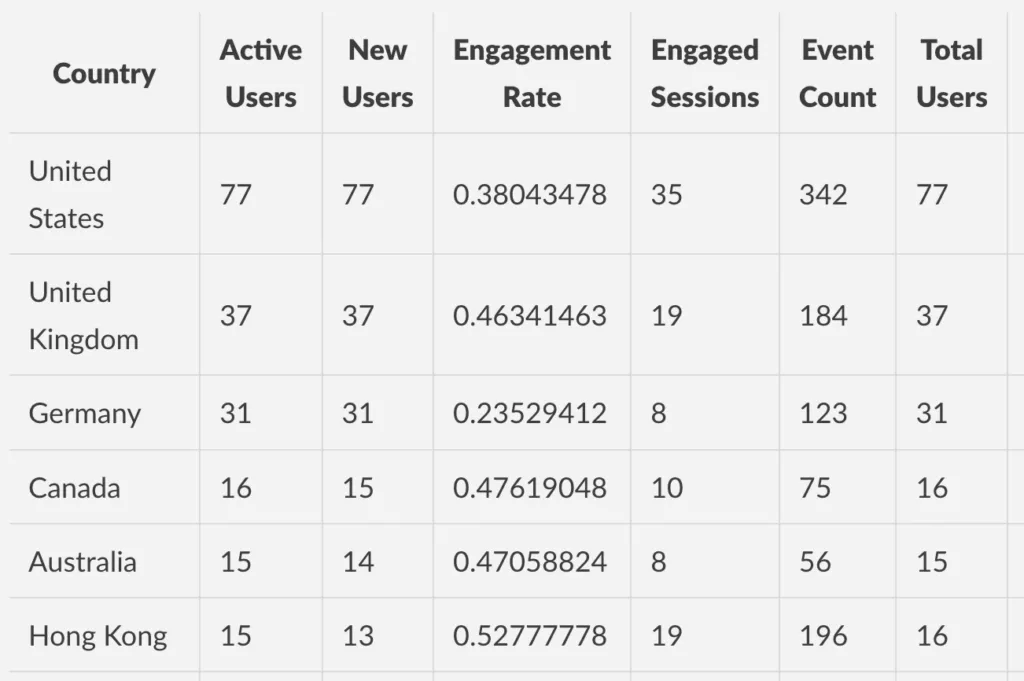
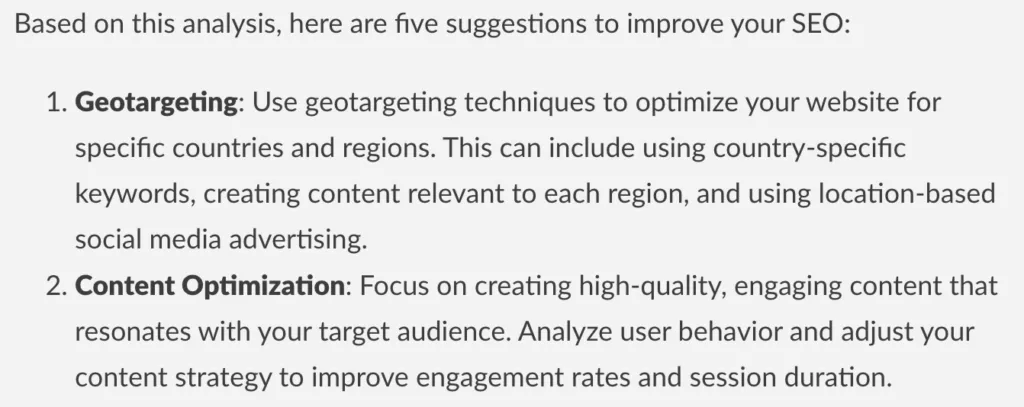
Here’s some screenshots of what type of reports you can get from our A.I. automation. Below is the table of views from past 7 days compared to last week. It will also offer SEO suggestions to improve.
My workflow contains 3 reports:
- Comparison of top performing pages
- Comparison of top performing countries
- Comparison of engagement
Setting Up Automated Analytics Workflow
Data overload is real. Many website owners struggle to make sense of their analytics. It’s like trying to drink from a fire hose.
The solution? Automation. Here’s how I set it up:
-
- Use n8n or make.com to create a workflow
-
- Connect to Google Analytics API
-
- Set up weekly data comparisons
The big win? You’ll save hours every week. Plus, you’ll get consistent, reliable data.
I remember my first automated report. It was like having a personal SEO assistant. The workflow pulled data on visitor engagement, page views, and organic searches. It compared this week to last week, giving me a clear picture of trends.
This wasn’t just about saving time. It was about getting better insights, faster. With automation, I could focus on strategy instead of data entry.
Now, let’s look at how AI takes this to the next level.
This is the A.I. prompts I use:
You are a Marketing Analytics professional.
Please analyze and compare the Google Analytics report for the past 30 days on Total sessions and Users per Country with the report for the prior month to determine information like:
- Traffic fluctuations
- Countries with increased and decreased traffic
- Forecast expected visitations for the upcoming weeks
You can also mention other important information not listed above.
Suggest how to adjust the marketing strategies proactively after analysing the data.
</google analytics report 30 days>{{2.text}}
</google analytics report>
</google report prior month>
{{4.text}}
</google report prior month>
Output this in a list format of 5 points.
You are a Marketing Analytics professional.
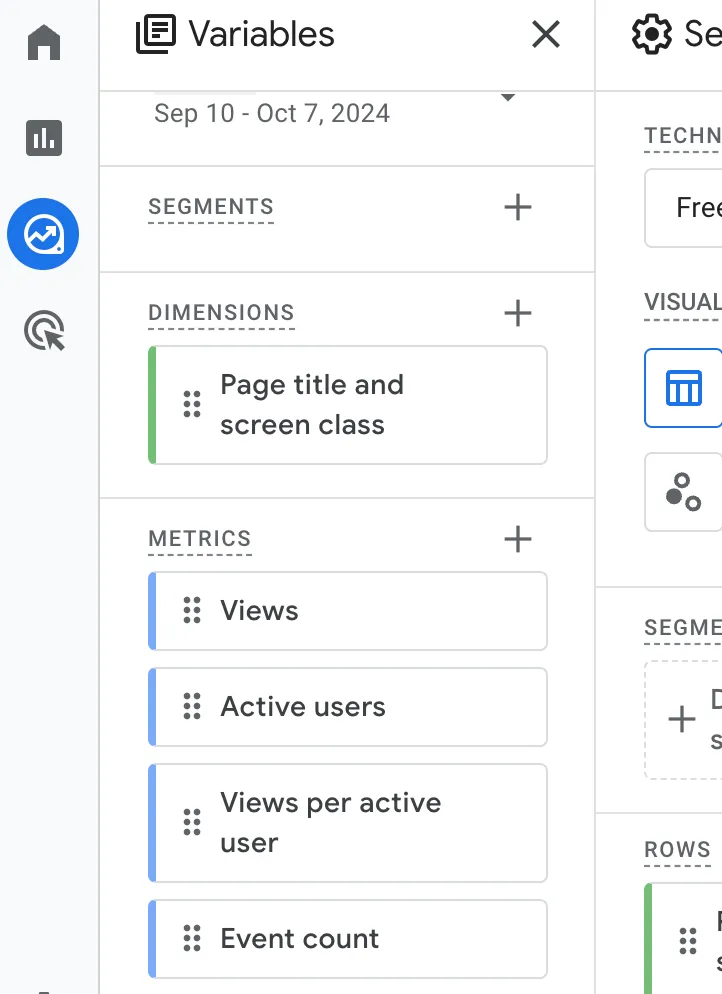
Please analyze and compare the Google Analytics report for the past 7 days on page title and screen class:
- views
- views per active user
- active users
- event count
You can also mention other important information not listed above.
Suggest how to adjust the marketing strategies proactively after analysing the data.
</google analytics report last 7 days>
{{13.text}}
</google analytics report>
</google report prior week>
{{15.text}}
</google report prior week>
Summarize the results. Use charts and tables where appropriate. Give 5 suggestions to improve.To get the google analytics modules working in make.com, you need to understand dimensions and metrics. It’s really simple, go to Google analytics, look at the reports and click “Export his report for analysis”. From there, you can copy the dimension and metrics settings you need.
Leveraging AI for Data Analysis
### Summary of Results
#### 1. **Overall Trends**
Upon comparing the performance metrics for landing pages across the last 7 days and the prior week, here's a high-level breakdown:
- **Organic Traffic:** Organic clicks from search engines remain relatively low across most pages.
- **Average Position:** Several pages rank well for their target queries, but some are slipping in rankings (e.g., `/top-post/`, `/ai-for-make.com/`).
- **Impressions:** Some posts, especially location-based "Top 5" articles and long-tail keywords like `/why-people-stopped-using-make.com/` and `/ultimate-guide-to-n8n/`, receive high impressions but very few clicks.
- **Engagement:** Engagement metrics (e.g., engaged sessions and engagement rates) are low for a significant portion of the pages.
This is an example of the output you can get!
Numbers are great, but insights are better. That’s where AI comes in. It’s like having a data scientist on your team.
Here’s the magic:
-
- Feed your analytics data into an AI model
-
- Ask it to summarize and suggest improvements
-
- Get actionable insights in seconds
The result? You become an SEO expert overnight.
I was skeptical at first. Could AI really understand my website’s unique challenges? But it surprised me. The AI spotted trends I’d missed and suggested tweaks I’d never considered.
For example, it noticed a drop in engagement on Tuesdays. It suggested I post my best content then to boost numbers. Simple, but effective.
AI doesn’t replace human insight. It enhances it. It’s like having a brainstorming partner who never sleeps.
Next, we’ll look at how to store and use these insights effectively.
Streamlining Reporting Process
Data is useless if you can’t access it easily. That’s why I connected my workflow to Airtable.
Here’s how it works:
-
- Set up an Airtable base for your analytics data
-
- Connect your n8n or make.com workflow to Airtable
-
- Automatically populate your base with weekly reports
The benefit? All your data in one place, ready for review.
I used to dread my weekly analytics meetings. Now, I look forward to them. I open Airtable, and everything’s there. Trends, insights, AI suggestions - all neatly organized.
This system doesn’t just save time. It improves decision-making. With easy access to historical data, I can spot long-term trends. I can test AI suggestions and track results over time.
Remember, the goal isn’t just to collect data. It’s to use it. This system makes that easy.
Conclusion
Becoming an SEO expert doesn’t have to be hard. With the right tools, anyone can do it. Automation and AI are game-changers in the world of analytics.
Think about it. No more hours wasted on data entry. No more head-scratching over confusing metrics. Just clear, actionable insights delivered weekly.
This system has transformed my approach to SEO. It can do the same for you. Are you ready to become an SEO expert?
Take the Next Step
Don’t let another week go by drowning in data. Set up your own automated analytics workflow today. Start with n8n or make.com. Connect to Google Analytics. Add some AI magic.
Need help? There are plenty of resources out there. Check out tutorials on YouTube or join online communities. The future of SEO is here. Will you be part of it?